The challenge
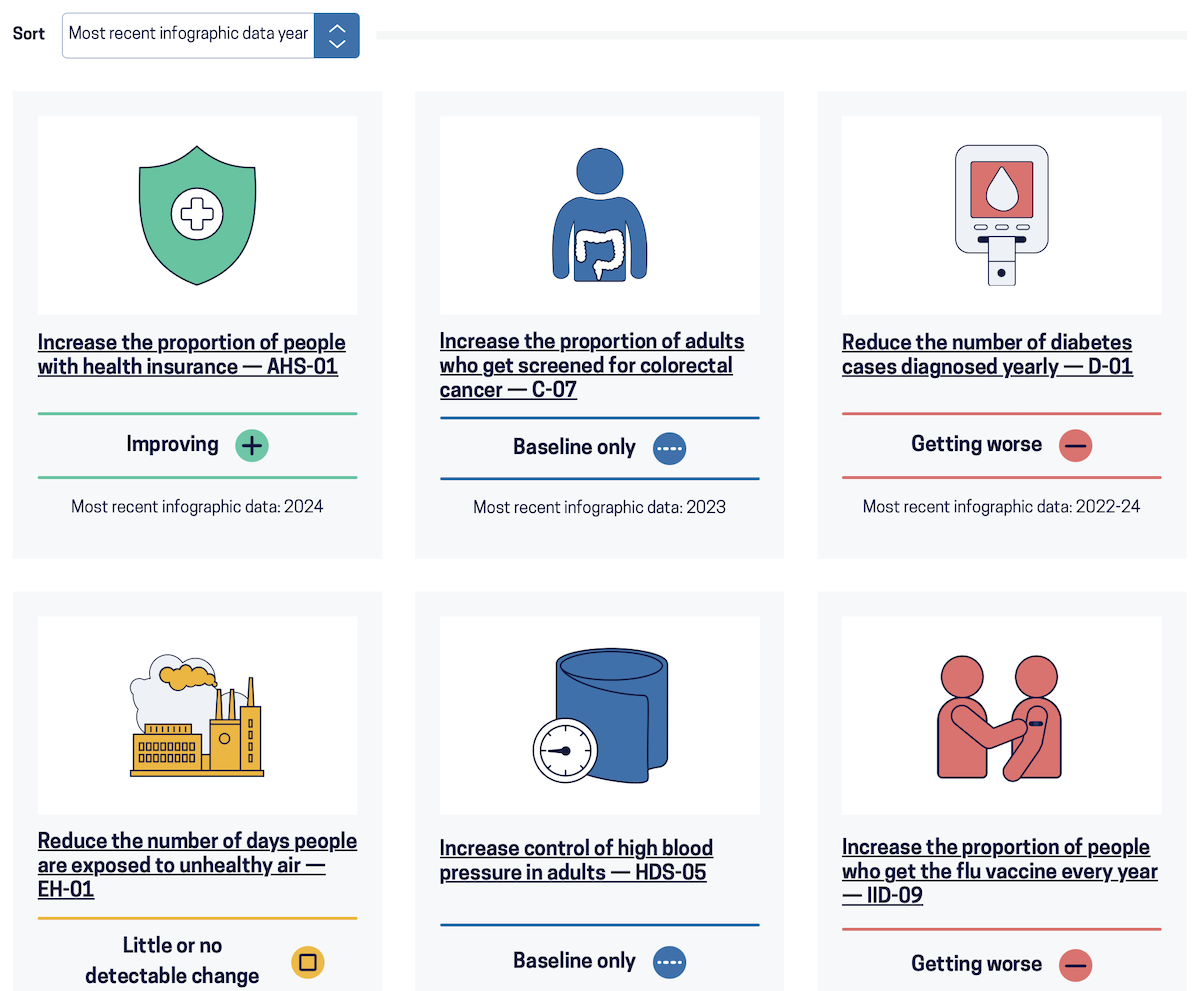
As part of the Healthy People 2030 initiative, 23 Leading Health Indicators (LHIs) were identified. Being able to easily interpret and visualize the data associated with these LHIs is key.
What we did
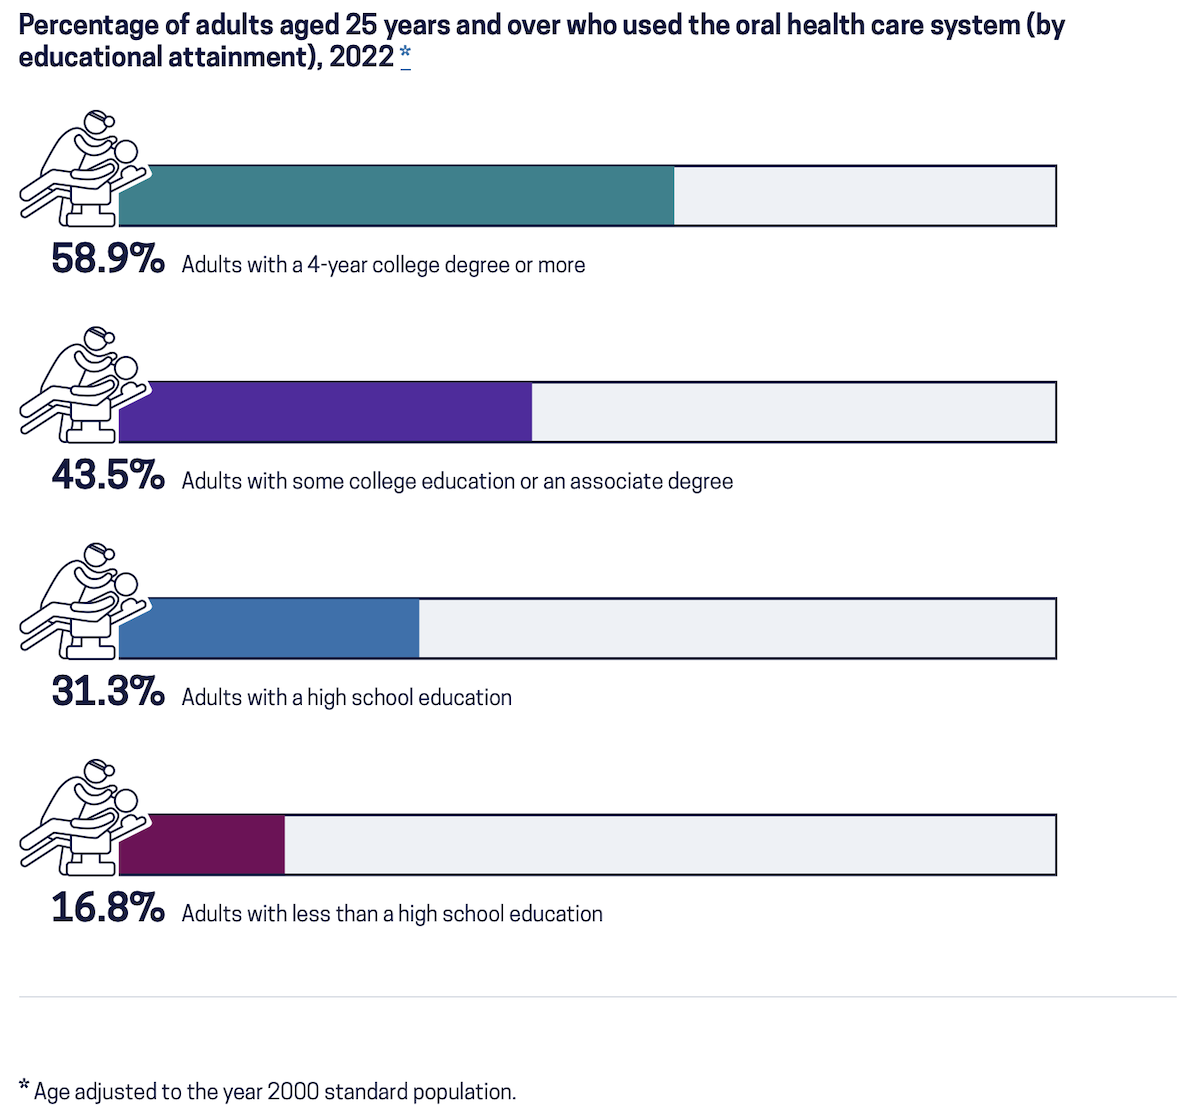
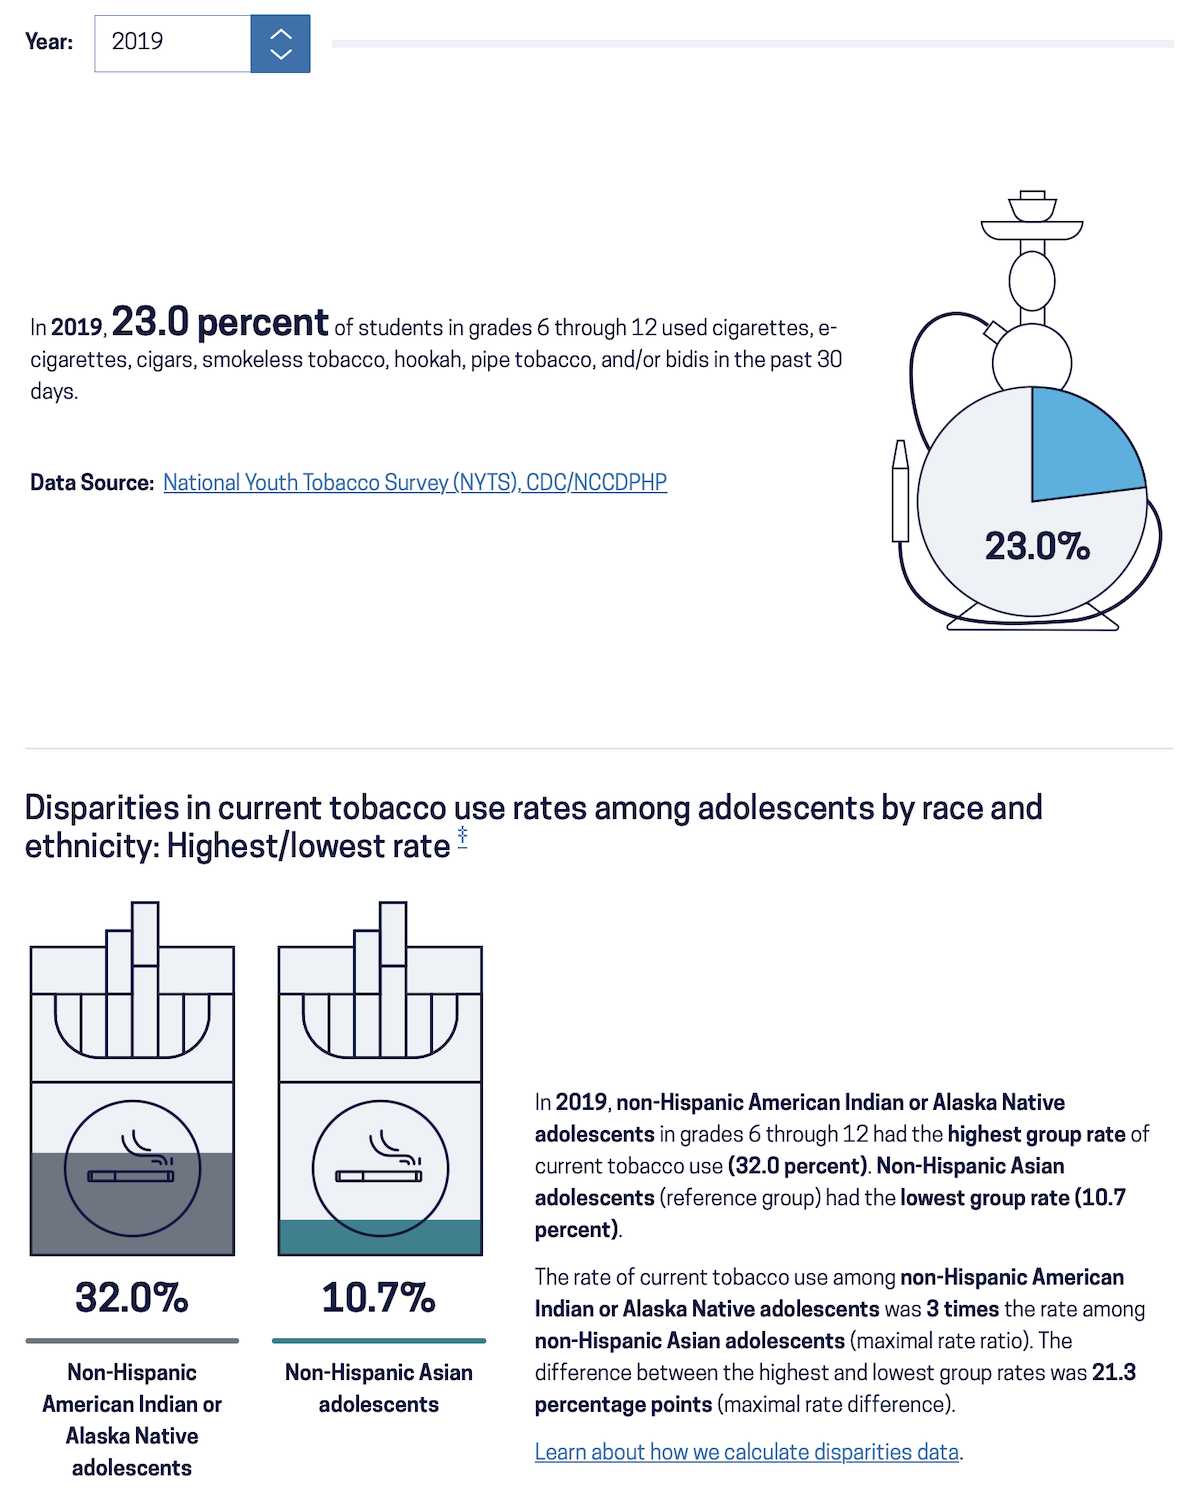
I spearheaded the creation of a tool that allows for customized infographics to be created for each of the 20+ LHIs. Along with bespoke data visualizations, these infographics have narratives that dynamically explain the data in plain language. Future iterations will add additional parameters to further customize the infographics. Both population- and location-specific parameters are in the pipeline.
Why it matters
Making it easy to interpret the data associated with these LHIs makes a real difference in the day to day life of our audiences. The narratives dynamically provide insights and highlight key findings. Having interesting ways to visualize the data also helps a lot when putting together reports or proposals based on the LHIs.