National Eye Institute: Interactive Eye Graphic
The challenge
The eye is a complex organism and the various stages of diseases and conditions affect the individual parts in specific ways.
What we did
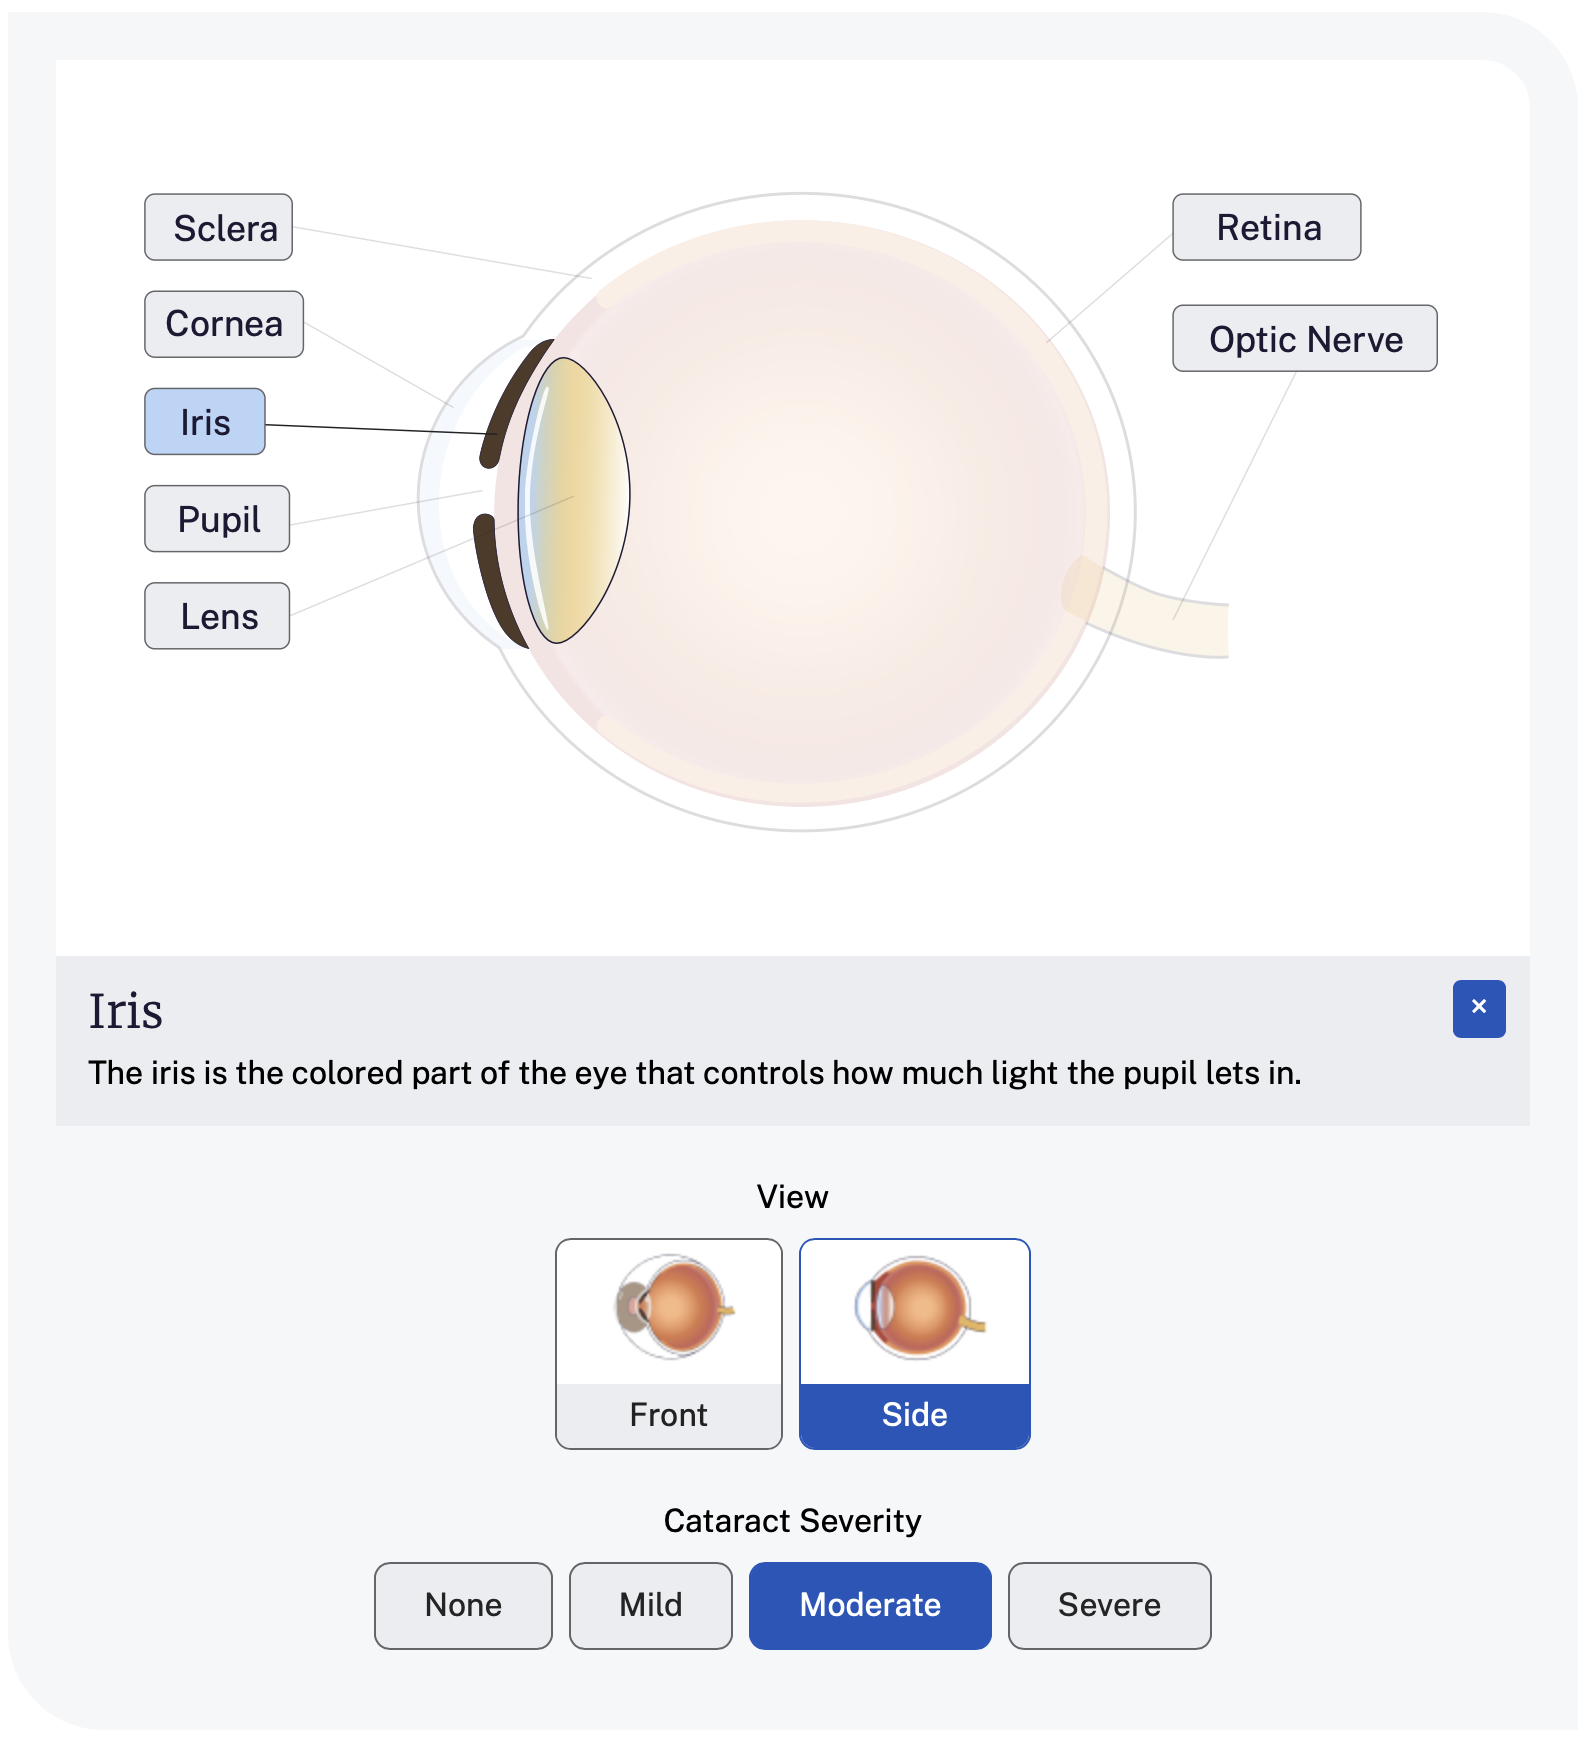
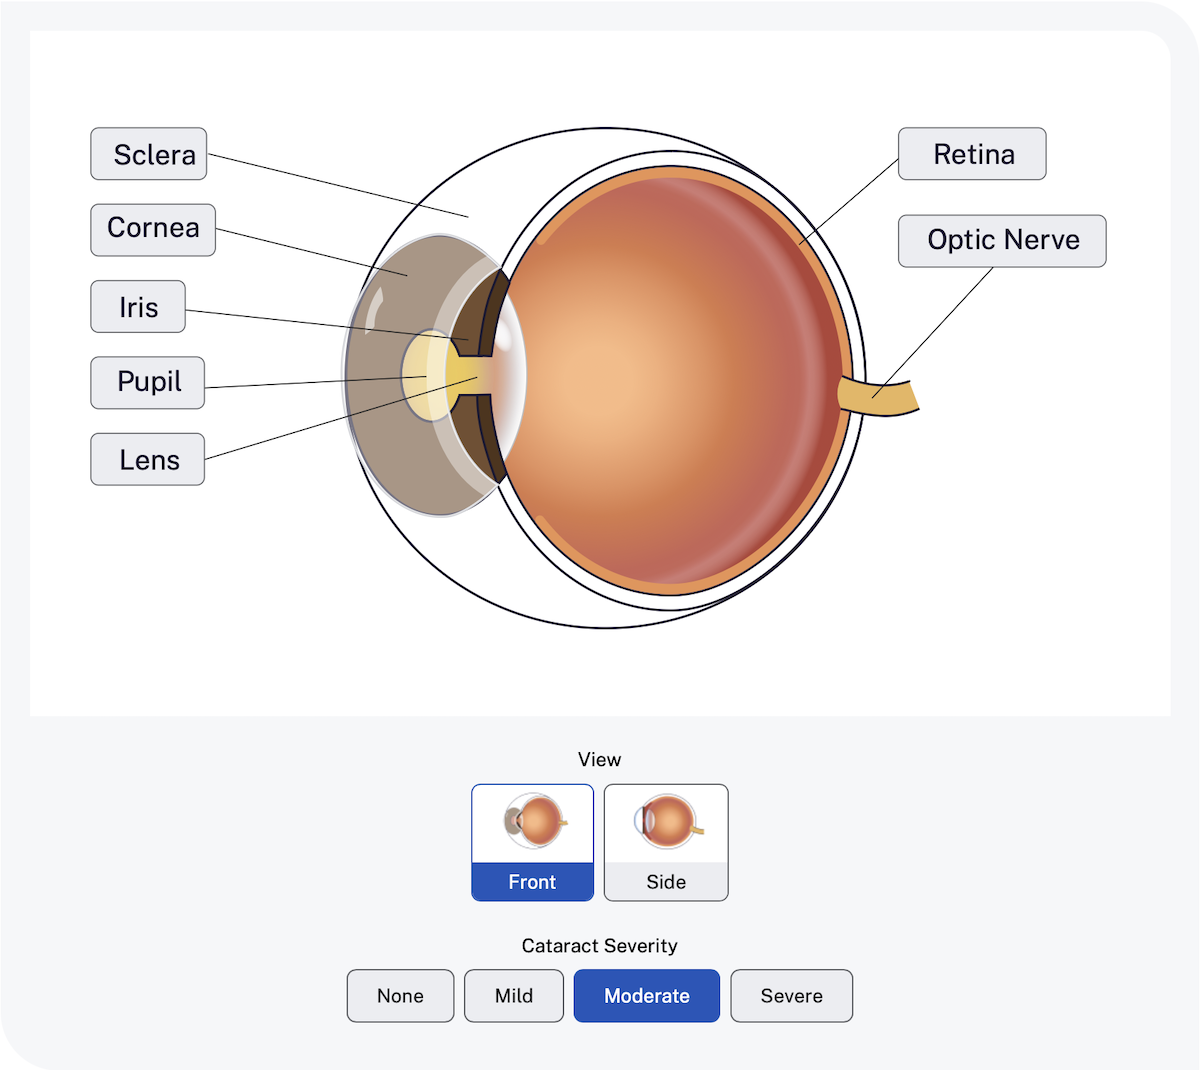
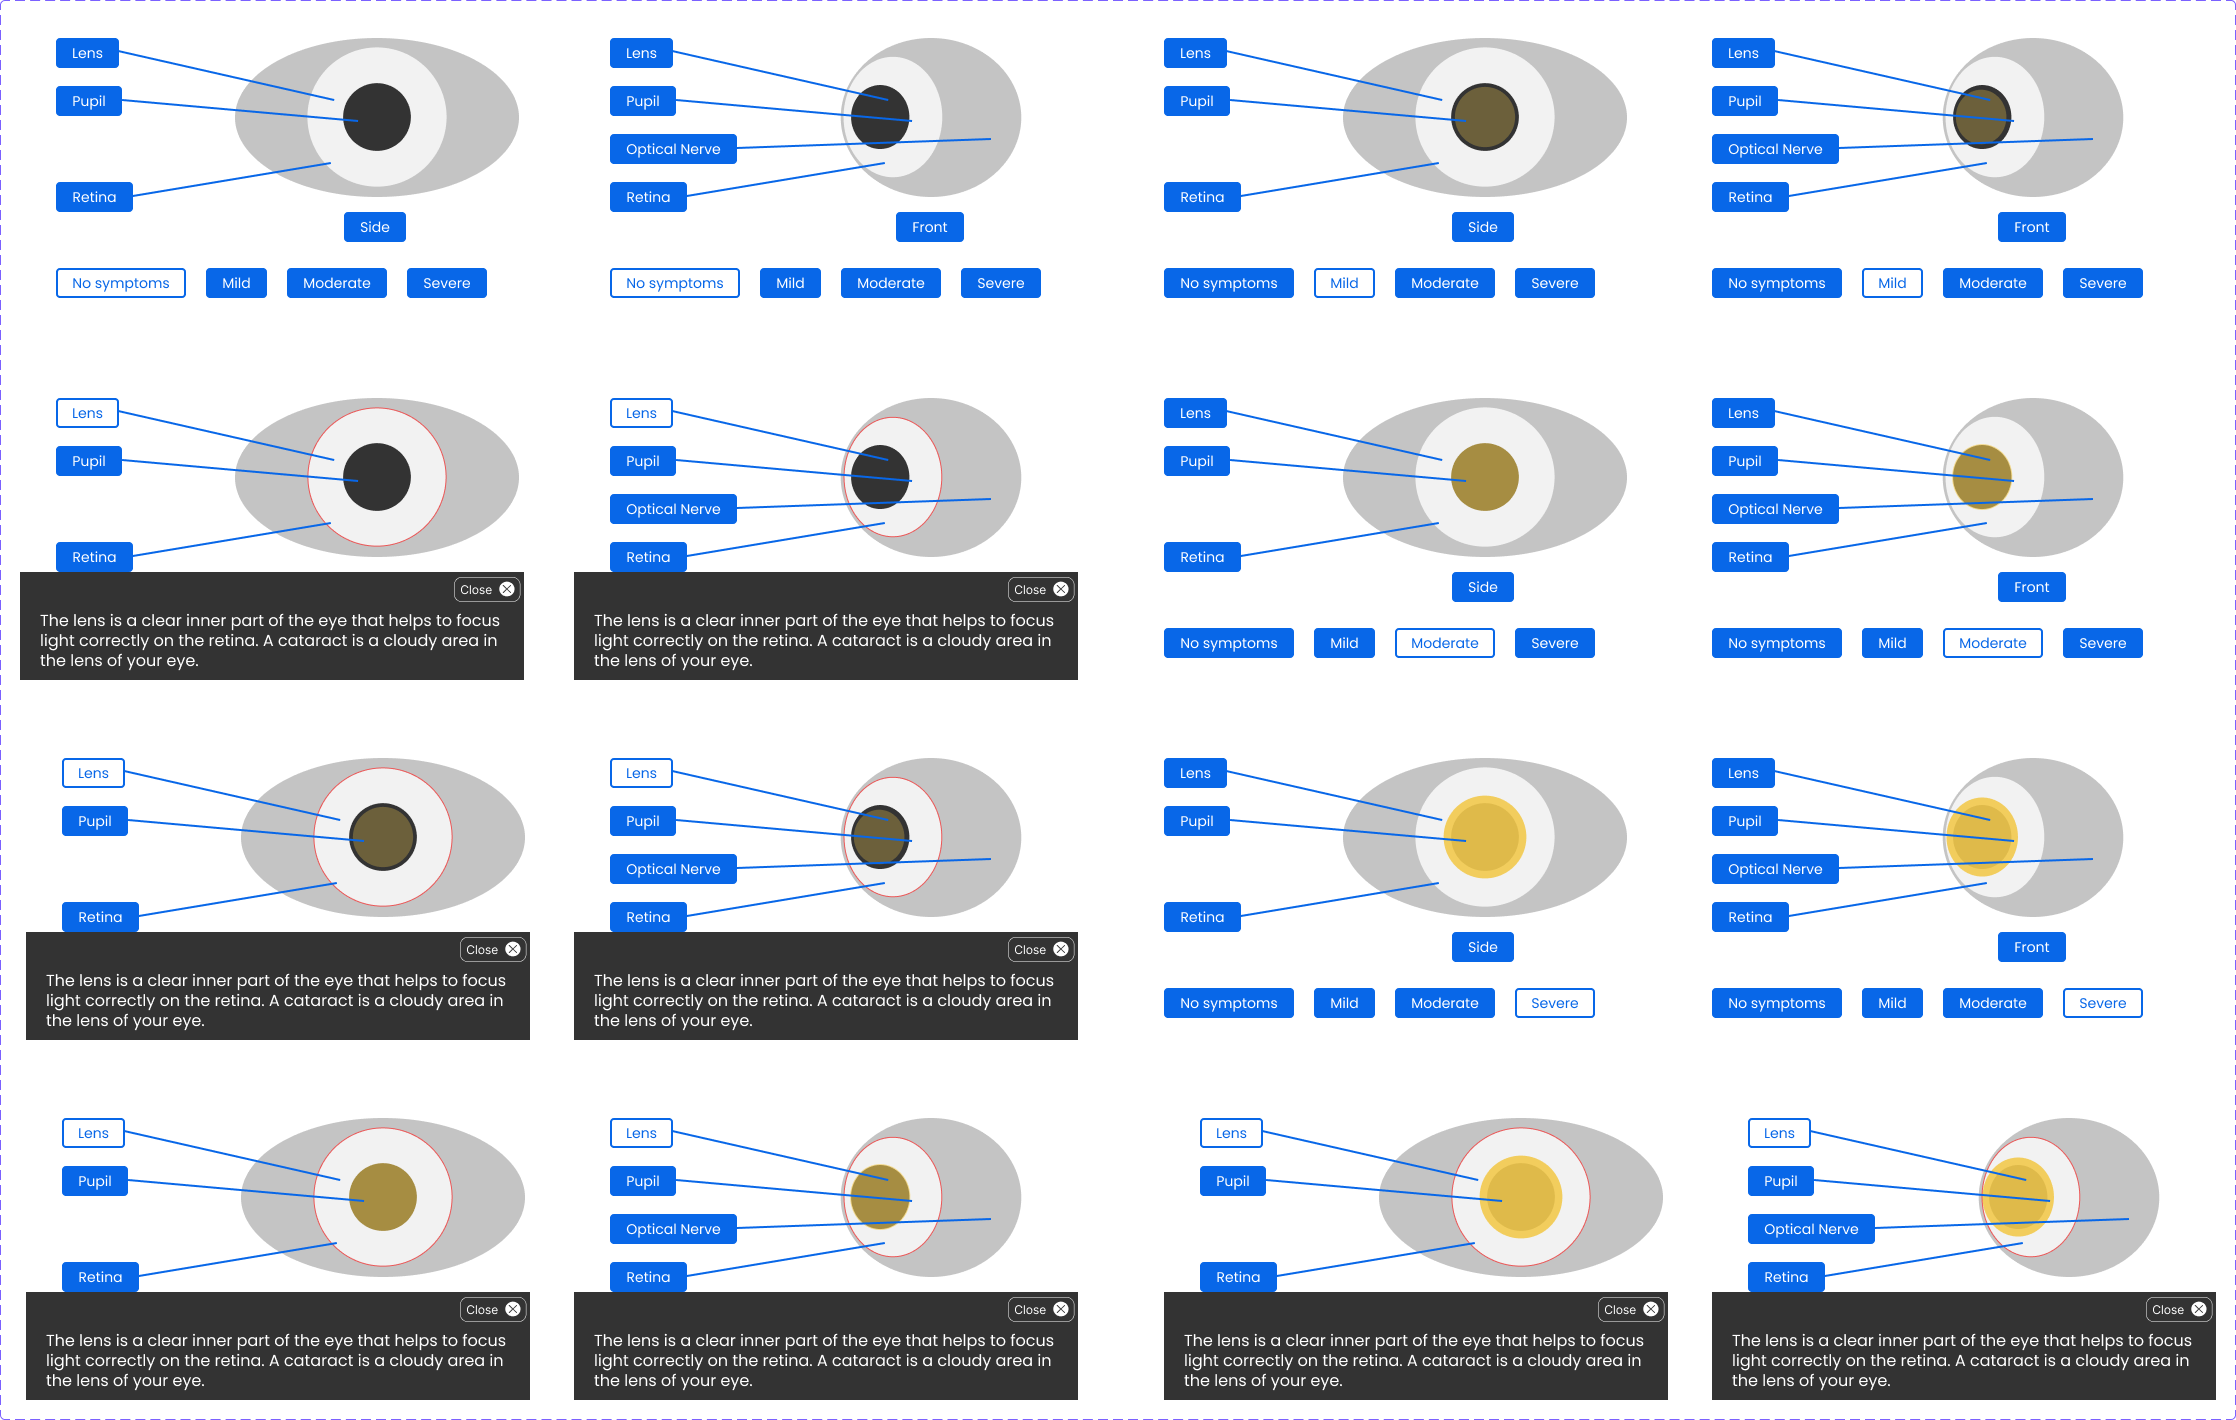
We created an interactive eye graphic tool that shows an anatomically correct eyeball in different angles and with different stages of cer tain eye conditions. Each par t of the eye can be highlighted which adds an informational overlay that explains what happens to this part of the eye at the selected stage of severity.
Why it matters
Being able to interact with a digital model of the eye, makes it much easier to understand how different conditions affect the parts of the eye. The graphic provides a consistent and familiar tool that can be reused across NEIs digital proper ties (website, apps, etc.). Each state of the graphic also works as a standalone illustration that can be used in a variety of ways.